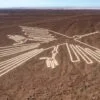


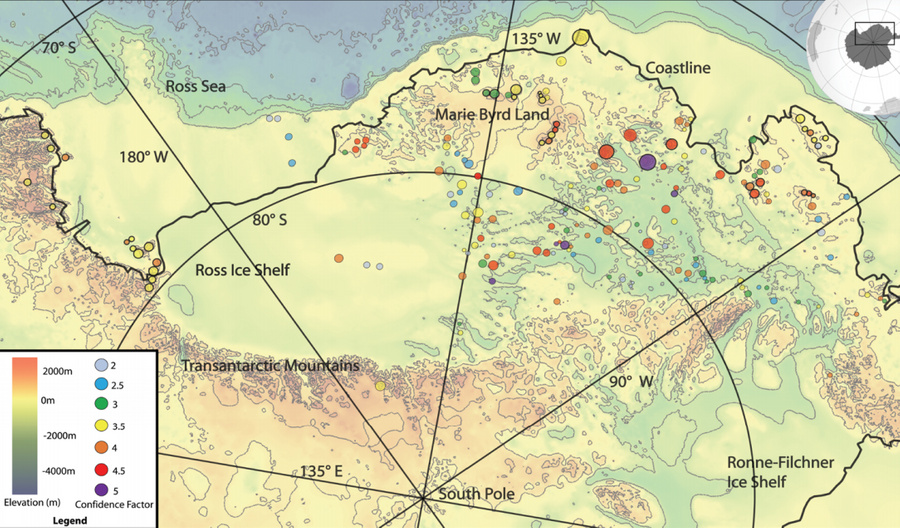
The volcanoes were not discovered. They were always there. The discovery was made in 2017 when a team from the University of Edinburgh, led by glaciologist Robert Bingham, completed a comprehensive radar survey of the bedrock beneath the West Antarctic Ice Sheet and found 178 conical structures beneath approximately four kilometers of ice. 138 of them met every geological criterion for classification as volcanoes. 47 had been previously known. 91 had never been identified.
The finding doubled the known volcanic count for the Antarctic continent and placed almost all of them in a single geographic zone: the West Antarctic Rift System, a geological structure 3,200 kilometers long that represents one of the largest active rift zones on Earth.
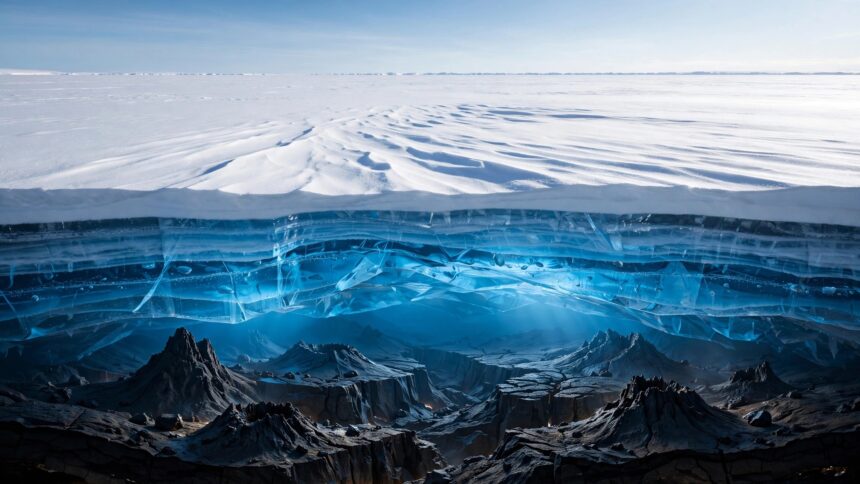
The volcanoes are not the story. Ice sheets suppress volcanic activity. The immense pressure of kilometers of ice above the Antarctic crust keeps the mantle rock at a pressure where it remains solid rather than liquid, preventing the magma generation that drives volcanic eruption. The volcanoes are dormant not because they have exhausted themselves but because the ice is holding them down.
The ice is melting.
The rate at which it is melting, the geographic relationship between the zones of most rapid ice loss and the zones of highest subglacial volcanic density, and the established mechanism by which ice removal triggers volcanic activity in rift zone geology, are the three facts that the 2017 discovery places in a configuration that the institutions monitoring both the glaciology and the volcanology have not fully addressed in a single integrated public communication.
The Mechanism
Iceland provides the clearest existing record of the process by which ice removal triggers volcanic eruption in rift zone geology, because Iceland sits over the Mid-Atlantic Ridge and experienced rapid post-glacial ice retreat at the end of the last glacial maximum, approximately 12,000 years ago.
Ice imposes pressure on the crust beneath it. The pressure is proportional to the ice’s mass and depth. Under kilometers of ice, the pressure on the underlying mantle rock is sufficient to suppress the partial melting that generates magma in rift zone environments. The mantle rock that would otherwise melt and rise toward the surface under the lower pressure conditions of an ice-free environment remains solid under the ice’s compressive load.
When the ice melts, the pressure decreases. The decrease is not instantaneous across the crust, but progresses as the ice thins. As the pressure drops, the mantle rock that was previously held solid by the ice load begins to cross the threshold into partial melting. The melt rises. The volcanic activity that was suppressed by the ice load begins.
This process is called isostatic rebound and its volcanic consequences appear in the Icelandic geological record. Studies of Icelandic volcanic eruption frequency over the past fifteen thousand years show a clear correlation between the periods of most rapid deglaciation at the end of the last glacial maximum and the periods of highest volcanic activity. During the most rapid phase of Icelandic deglaciation, approximately 12,000 to 10,000 years ago, volcanic activity was estimated to be thirty to fifty times higher than the current rate. As the deglaciation slowed and the isostatic adjustment approached equilibrium, volcanic activity declined toward current levels.
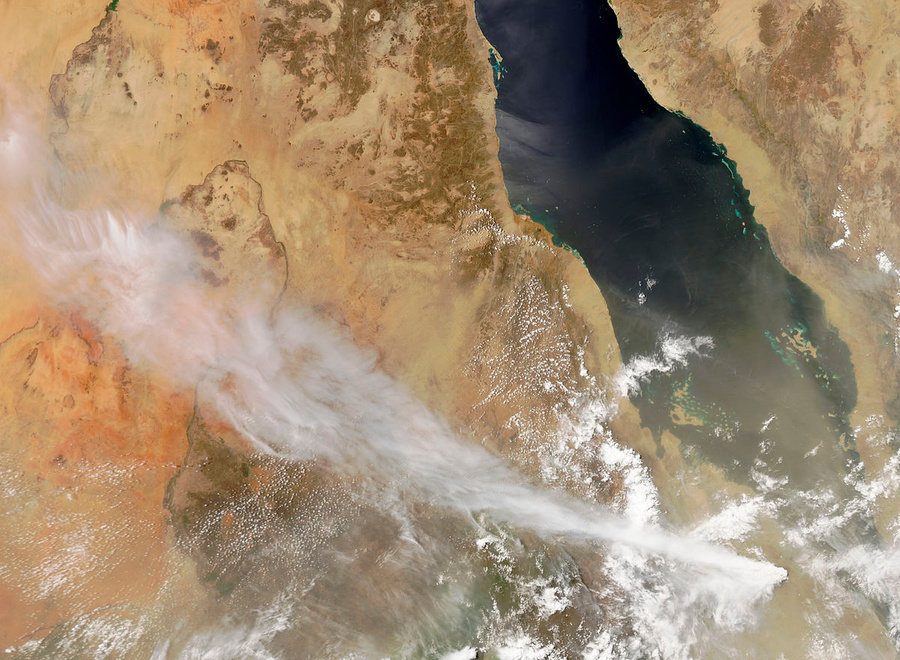
Photo © Wikipedia
The isostatic rebound mechanism is not hypothetical. It appears in the geological record of a region that experienced exactly the ice removal scenario that Antarctica is currently undergoing through a different driving mechanism.
Iceland’s deglaciation was driven by the end of the glacial maximum. Antarctica’s deglaciation is being driven by anthropogenic warming. The mechanism by which ice removal triggers volcanic activity operates regardless of why the ice is removing.
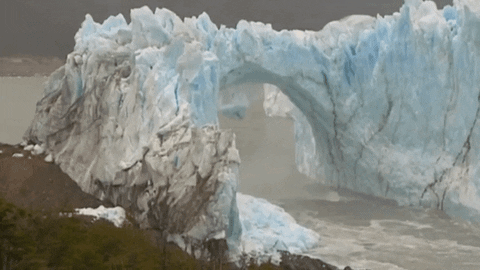
Thwaites
The Thwaites glacier is approximately the size of Florida. It occupies the western edge of the West Antarctic Ice Sheet, draining a catchment area of approximately 192,000 square kilometers into the Amundsen Sea. It has been losing mass since at least the late 1990s, when satellite measurements first became comprehensive enough to track its changes systematically.
By 2019, researchers estimated that Thwaites had lost approximately 600 billion tons of ice since 2000. The loss rate has been accelerating: measurements show the glacier retreating faster in each successive decade of the measurement period. The mechanism driving the Thwaites retreat is warm ocean water intrusion beneath the glacier’s ice shelf: relatively warm water from the deep Southern Ocean is circulating under the floating ice shelf that extends beyond the grounding line into the Amundsen Sea, melting the ice from below in a process that the ice shelf’s protective function cannot prevent.
The Thwaites ice shelf acts as a buttress, slowing the flow of the inland ice into the ocean. As the shelf thins, its buttressing effect decreases, and the inland ice accelerates. Radar surveys of the glacier’s underbelly have shown a growing cavity between the ice and the bedrock at the grounding line, indicating that the connection between the inland ice and the seafloor is retreating.
If the Thwaites ice shelf collapses, the inland ice behind it accelerates toward the ocean. The consequent sea level rise contribution from Thwaites alone is estimated at approximately half a meter to two meters globally, depending on the collapse scenario and the timescale. The collapse of the broader West Antarctic Ice Sheet that Thwaites stabilizes contributes an additional two to four meters.
The geographic location of the Thwaites catchment area sits directly above the zone of highest subglacial volcanic density identified in the Edinburgh survey. The bedrock under Thwaites and the adjacent glaciers of the Amundsen Sea embayment is the same West Antarctic Rift System where 138 volcanoes wait under the ice.

Photo © Wikipedia
As the ice above them thins, the pressure holding their underlying mantle rock solid decreases. The Iceland mechanism operates on timescales of thousands to tens of thousands of years in the geological record, but the driving rate matters: faster ice removal means faster pressure decrease means faster initiation of the partial melting process. The current Thwaites thinning rate, measured in meters per year, is at the aggressive end of the deglaciation scenarios that scientists had been modelling.
The Temperature Thresholds
In September 2020, researchers at the University of Potsdam published a study providing temperature thresholds for Antarctic ice sheet behavior.
At plus one degree Celsius above pre-industrial levels: increased snowfall in Antarctica slightly increases the ice mass of the eastern sheet. The western sheet continues to lose mass but more slowly.
At plus two degrees Celsius: the western ice sheet’s retreat becomes effectively irreversible. The dynamic instability known as marine ice sheet instability kicks in: once the grounding line retreats past a certain point on the bedrock topography, the process becomes self-sustaining regardless of external temperature. The sea level contribution from this scenario is approximately two meters.
At plus six degrees Celsius: Antarctica loses approximately 70% of its ice mass. Sea level rise contribution reaches approximately forty meters globally.
The current global average temperature is approximately 0.75 to 1.1 degrees Celsius above the pre-industrial baseline, depending on the measurement period and baseline definition used. The trajectory of current emissions places the 2100 temperature anywhere between 1.5 degrees Celsius, achievable only with significant near-term emissions reduction, and 4.0 degrees Celsius or higher under continued current trajectory scenarios.
The Paris Agreement’s 2.0 degree target is the threshold at which the University of Potsdam research places western Antarctic ice sheet collapse as effectively irreversible. Whether the Paris target is achievable is a question that current national emissions trajectories have not definitively answered.
The volcanic threshold is not explicitly modeled in the Potsdam research, because the Potsdam study was a glaciological analysis rather than a volcanic risk assessment. The Edinburgh volcanic survey was a geological analysis rather than a feedback systems assessment. The integration of the two findings into a single scenario, in which ice thinning above the volcanic province triggers isostatic rebound which accelerates both volcanic activity and ice loss through subglacial heating, has been discussed in the scientific literature but has not been the subject of a comprehensive published risk assessment.
The feedback loop is: warming thins the ice. Thinned ice reduces pressure on the volcanic province. Reduced pressure initiates partial mantle melting. Rising magma heats the ice from below, accelerating thinning. Accelerated thinning further reduces pressure. The loop tightens.
Erebus and What It Tells Us
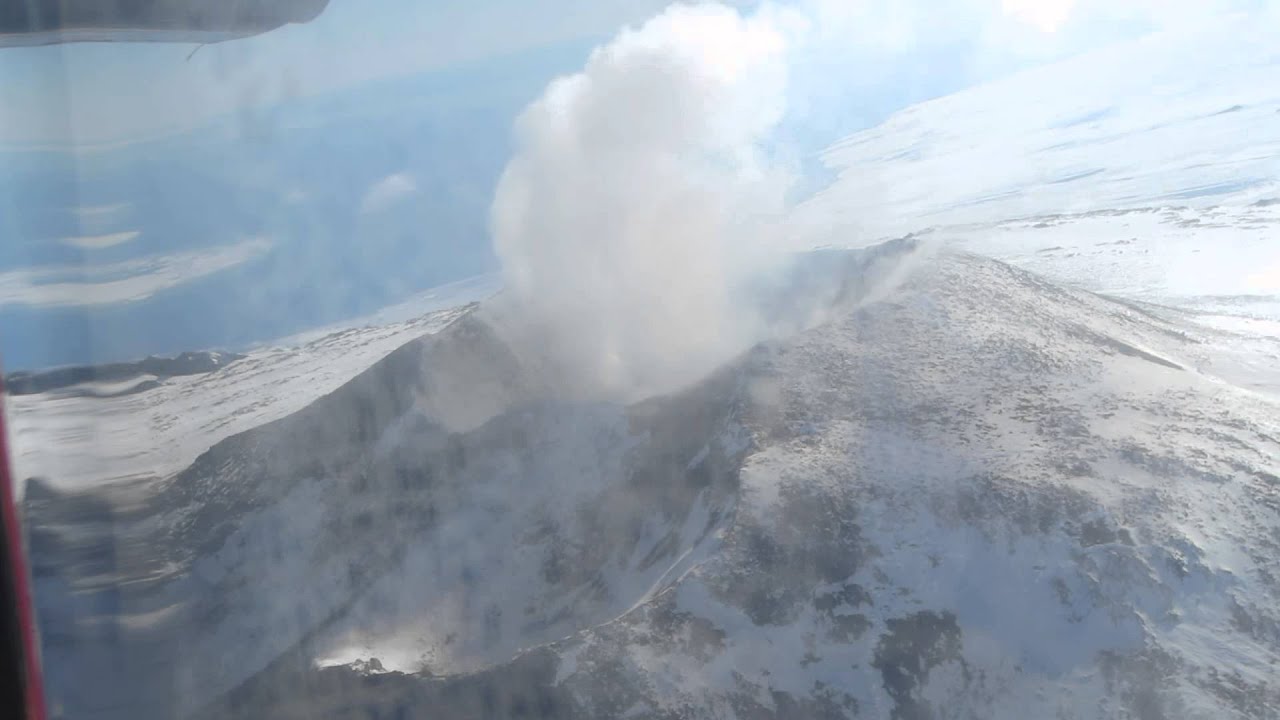
Mount Erebus, at 3,794 meters the highest active volcano in Antarctica, sits on Ross Island approximately 1,400 kilometers from the main concentration of the newly discovered volcanoes. It is the most extensively studied Antarctic volcano and provides the best available data on what the volcanic province produces when active.
Erebus erupts continuously. It contains a persistent lava lake, one of only a few in the world, whose surface temperature has been measured at approximately 700 to 1,000 degrees Celsius. The lava’s high viscosity means that it rarely produces explosive eruption events, instead releasing gas continuously and producing occasional lava bomb ejection around the crater’s rim.
The gas composition is significant. Erebus produces sulfur dioxide, hydrochloric acid, hydrogen fluoride, and carbon monoxide, along with water vapor and carbon dioxide. The combination of sulfur dioxide and hydrochloric acid produces the most aggressive chemical attack on the stratospheric ozone layer of any natural emission source. The World Meteorological Organization’s observation of the ozone hole above Antarctica reaching 25 million square kilometers in recent monitoring periods is consistent with Erebus’s continuous contribution, though the primary driver of the ozone hole is historically the anthropogenic chlorofluorocarbon accumulation.
Researchers from the University of New Mexico conducting gas sampling above Erebus’s plume in the 1990s found gold particles at concentrations of approximately 0.08 grams per 1,000 tonnes of volcanic gas. The annual gold emission from Erebus is estimated at approximately 80 grams. The discovery is a curiosity in the context of the Anunnaki gold narrative covered elsewhere in this library. In the context of the Antarctic volcanic risk assessment, it demonstrates the unusual geochemical character of the Antarctic volcanic province: its emissions are not the standard basaltic outgassing of a typical mid-ocean ridge volcano. They reflect the deep-mantle geochemistry of the West Antarctic Rift System, which is geologically distinct from the oceanic rift systems and continental hotspot volcanism that produce most of the world’s active volcanic output.
The Toba Reference Point
The scale of what large-scale volcanic activity can produce in human civilizational terms has one clear reference point in the geological record of the past hundred thousand years.
Approximately 74,000 years ago, the Toba supervolcano in what is now Sumatra, Indonesia, erupted in the largest volcanic event of the past two million years. The eruption ejected approximately 2,800 cubic kilometers of material, compared to the 1.0 cubic kilometers that the 1991 Pinatubo eruption produced. The volcanic winter produced by the Toba eruption, driven by the sulfate aerosol loading of the stratosphere, lasted an estimated six to ten years. Global average temperatures dropped by approximately three to five degrees Celsius during the volcanic winter phase.
The Toba bottleneck hypothesis, developed by researcher Stanley Ambrose of the University of Illinois, proposes that the volcanic winter following the Toba eruption reduced the human population to between 3,000 and 10,000 individuals. The hypothesis rests on the observed low genetic diversity of the human species compared to other great apes: our species shows genetic diversity consistent with descent from a population that passed through a severe bottleneck at approximately this period.
Whether the Toba eruption alone caused the bottleneck, or whether the bottleneck reflects other demographic processes, is debated in the paleoanthropological literature. The genetic evidence for a bottleneck in the relevant time period is not debated.
Toba was a single supervolcano erupting once. The Antarctic scenario, at its extreme end, involves 138 volcanoes becoming active in a region where ice removal is accelerating their isostatic rebound simultaneously. The scenarios are not equivalent: most of the newly identified Antarctic volcanoes are not Toba-scale structures. But the combined stratospheric sulfur dioxide loading from a large-scale simultaneous increase in Antarctic volcanic activity, especially combined with the sulfur dioxide contribution from an already active Erebus and from any existing active volcanoes in the province, would produce a global cooling signal through exactly the mechanism that the Little Ice Age solar minimum research documents.
The Antarctic volcanic scenario and the solar minimum scenario are not independent risks. They share a final pathway, stratospheric sulfur dioxide and sulfate aerosol loading reducing global solar irradiance, that they would amplify if they converged in timing.
What Is Already Moving
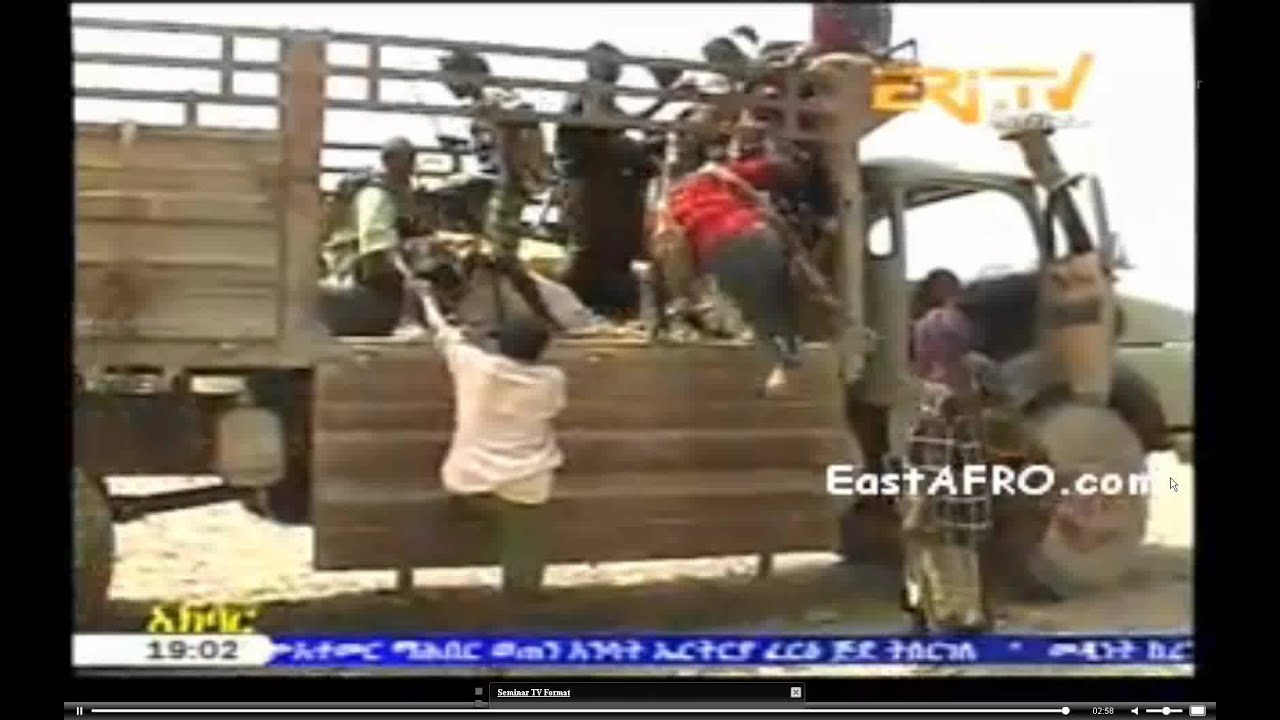
The Nabro volcano in Eritrea erupted in June 2011, having been classified as dormant throughout recorded history. It produced the largest sulfur dioxide plume ever measured from space by a single eruption event. The East African Rift Valley, where Nabro sits, is the geological system most closely analogous to the West Antarctic Rift System in structure and tectonic setting.
The analogy is structural, not predictive. Nabro’s eruption does not predict Antarctic volcanic activity. It demonstrates the property of rift zone volcanism that makes the Antarctic situation significant: volcanoes classified as dormant in rift zone environments erupt. The classification reflects the absence of observed historical activity, not the absence of active geological processes beneath the surface.
The instruments available in 2011 were capable of measuring the Nabro eruption’s atmospheric impact from orbit. The 2017 Edinburgh survey used ground-penetrating radar to identify the volcanic structures beneath the Antarctic ice. The glaciological monitoring of Thwaites and the surrounding glaciers uses a combination of satellite altimetry, GPS bedrock movement sensors, and oceanographic instruments to track the ice loss in near-real time.
The data is being collected. The individual pieces of the feedback scenario are recorded across multiple institutional monitoring programs that do not routinely publish integrated assessments of the combined risk.
The 138 volcanoes are real and recorded. The ice above them is thinning. The mechanism by which ice thinning triggers volcanic activity appears in Iceland. The rate of ice loss is measured in meters per year rather than centuries per year.
The scenario does not require prediction. It requires only integrating what the separate monitoring programs are each recording individually.
The ice keeps the volcanoes dormant. The mechanism that keeps the ice in place is failing at a rate that the instruments confirm. What happens when the mechanism fails appeared in Iceland twelve thousand years ago and has not changed since.