





Gold did something in 2026 that would have sounded absurd only a few years ago: it broke through $5,000 an ounce and kept going. The January surge carried spot gold to roughly $5,600 an ounce, an extraordinary new high, after a 67 percent gain during 2025 that the World Gold Council described as the strongest annual performance since 1979. By September, the metal had pulled back into the mid-$4,000s, but the underlying story had not disappeared. Central banks were still buying, investors were returning to gold-backed ETFs, governments were still carrying enormous debt, and professional banks were still publishing competing forecasts in public. The evidence does not point to a secret evacuation from the financial system. It points to something less cinematic and more consequential: a global repricing of gold that was visible long before the internet gave it a conspiracy narrative.
That distinction matters. A theory about insiders secretly fleeing the system asks the reader to infer an invisible event from a visible price. The documented record runs in the opposite direction. The price moved first, but the reasons were not hidden: monetary policy, reserve diversification, geopolitical risk, investment demand, currency concerns, and a market increasingly treating gold as a strategic asset rather than merely a commodity. The extraordinary part is not that someone supposedly knew what was coming. The extraordinary part is that the market was telling everyone what it thought was coming, and was doing it in public.
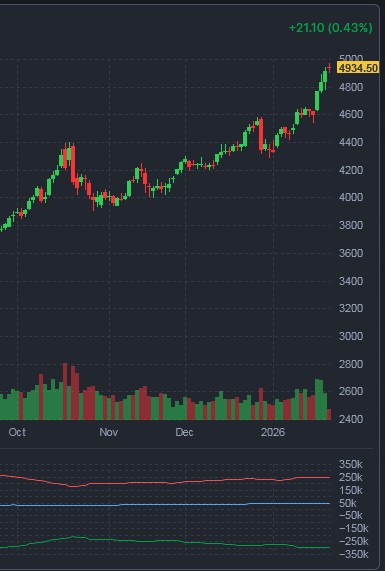
Gold Really Did Break $5,000, and the Numbers Matter
The actual trajectory is more dramatic than the insider-exodus version because the underlying price move was real enough without embellishment. Gold crossed $4,000 in October 2025 and finished that year with a 67 percent gain. The World Gold Council recorded 53 new all-time highs during 2025, while total annual gold demand reached a record 5,002 tonnes and global investment demand reached 2,175 tonnes. Then January 2026 delivered another extraordinary acceleration: gold moved through $5,000 and reached an intraday peak of roughly $5,600 near the end of the month. Reuters reported the record at about $5,595, while market data from the period put the January 28 high above $5,600. The precise number varies with the benchmark and trading venue, the important fact does not. Gold had entered territory that had never existed in the modern price record.
And then came the part that conspiracy narratives often leave out: gold did not simply rise forever. By September 11, 2026, spot gold was around $4,363 an ounce, roughly 22 percent below the January record, while still dramatically above its levels a year earlier. The Federal Reserve had become a major variable again, with inflation data pushing markets toward expectations of a possible rate increase rather than the easy-cut narrative that had helped propel gold earlier in the year. In other words, the same market that had once rewarded gold for falling-rate expectations was now repricing it when yields and rate expectations moved against it. That is not what a secret one-way evacuation looks like. It is what a functioning, extremely volatile market looks like when macroeconomic assumptions change.

The Forecasts Were Public. They Were Also Wrong Sometimes.
This is one of the most revealing parts of the story. If banks were secretly preparing for an event they knew would radically change the value of gold, we would expect their public forecasts to look strangely timid, coordinated, or retrospectively defensive. Instead, the record looks much more ordinary, and therefore much more useful. UBS was publicly bullish in January, raising its target to $6,200 for March, June and September while projecting $5,900 at year-end. Goldman Sachs, Deutsche Bank, Société Générale, Morgan Stanley, JPMorgan, HSBC, Bank of America and others were publishing their own targets, with substantial disagreement between them. Some were more bullish than others, and those forecasts subsequently moved as the market moved.
JPMorgan is particularly instructive because its forecast changed in the direction a normal forecasting model changes when reality changes. By July, the bank had lowered its 2026 expectations, calling for roughly $4,300 in the third quarter and $4,500 in the fourth, after previously being much more bullish. Reuters’ July survey of analysts likewise showed forecasts being cut as higher rates and weaker demand challenged the earlier bullish case. UBS had raised its targets in January and later adjusted its outlook as Treasury yields changed. This is not evidence that the banks knew less than the public. It is evidence that they were responding to the same public market they were trying to forecast.
That distinction is crucial. A forecast is not a confession. A bank raising its gold target does not mean the bank knows a catastrophe is coming. A bank cutting it later does not mean the catastrophe was cancelled. And a bank’s internal positioning cannot be inferred from the price of gold alone. What can be established is much simpler: professional institutions saw the same forces that pushed gold higher, assigned probabilities to them, published their assumptions, and repeatedly revised their numbers as the evidence changed.

The Central-Bank Story Is Real, But It Is Not a Secret
There is, however, one part of the supposedly hidden story that deserves to be taken seriously: central banks really have been buying gold at historically elevated rates. The important correction is numerical. Central banks did not buy more than 1,000 tonnes in 2025, according to the World Gold Council’s final estimate, net purchases were 863.3 tonnes. That was lower than the extraordinary totals above 1,000 tonnes recorded in each of the preceding three years, but it remained far above the 2010-2021 average of roughly 473 tonnes. The strategic shift is therefore real, but it does not require inventing a covert war plan. Reserve managers themselves have openly cited diversification, geopolitical uncertainty and gold’s long-term reserve role.
The 2026 data make the picture even more interesting. Central-bank buying slowed sharply in the first quarter, then rebounded to 288.9 tonnes in the second quarter, the strongest second quarter on record in the World Gold Council’s series. Poland remained a major buyer, China increased its pace, and the Council’s 2026 central-bank survey found that 89 percent of respondents expected global gold reserves to increase over the following twelve months, while a record 45 percent expected their own holdings to rise. That is not evidence of a secret meeting in which governments decided to abandon the dollar. It is something more measurable: reserve managers increasingly treating gold as a strategic asset in a world of geopolitical and financial uncertainty.
And there is an important reason to resist the temptation to call this “de-dollarization” in the strongest possible sense. Buying gold does not automatically mean selling dollars. Central banks manage diversified reserves for many reasons, and gold is only one component. The evidence supports a persistent desire for diversification and insurance against geopolitical and financial risk. It does not, by itself, prove that governments have secretly decided the existing monetary system is about to collapse.
The Newest Evidence Is Almost the Opposite of a Secret Exodus
If the gold rally were simply the residue of insiders escaping before the public noticed, the latest investment data would be difficult to explain. In August 2026, global physically backed gold ETFs attracted $18 billion of net inflows, the second-largest monthly inflow on record. Holdings increased by 121 tonnes to an all-time high of 4,189 tonnes, while assets under management climbed to $615 billion. The World Gold Council described the move as a broad return of investment demand, led particularly by North American and European-listed funds. That is not an invisible elite leaving through a side door. It is visible capital moving into a transparent investment vehicle in quantities large enough to appear in the industry’s public statistics.
The distinction becomes even more important when the timing is considered. ETF investors had spent much of the year under pressure, and gold-backed funds experienced substantial selling during the second quarter as prices fell and expectations for inflation, interest rates and the dollar changed. Then investors came back aggressively in August. The market therefore did not behave as though one permanent class of insiders possessed one permanent piece of secret information. Different groups bought and sold at different moments because their expectations changed. That is precisely what markets are supposed to do.

Why Gold Actually Rose
The public explanation for gold’s rise is not a single cause. It is an accumulation of forces that all point in roughly the same direction. Lower interest-rate expectations reduced the opportunity cost of holding an asset that pays no interest. A weaker dollar made gold cheaper for holders of other currencies. Geopolitical instability increased demand for assets regarded as stores of value outside the credit system. Central banks continued accumulating reserves. Investors sought diversification as government debt and fiscal uncertainty became harder to ignore. And the sheer momentum of a market making repeated records created another feedback loop as investors who had stayed out began to worry about missing the move.
None of these explanations requires us to believe that every buyer was correct. Gold can rise because investors expect inflation and then fall when real yields rise. It can rally because of geopolitical fear and then retreat when traders decide the risk is contained. It can benefit from central-bank purchases while simultaneously suffering from ETF outflows. That apparent contradiction is not a weakness in the explanation. It is the explanation. A financial market is not a single mind. It is millions of institutions and individuals constantly repricing the future.
UBS’s January research makes the mechanism unusually clear. The bank pointed to robust investor and central-bank demand, the outlook for U.S. rate cuts and rising government debt, while explicitly describing gold as a strategic diversifier. Its analysts were not describing a mysterious signal from the future. They were describing the opportunity cost of holding a non-yielding asset, the behavior of reserve managers and the macroeconomic environment visible in ordinary economic data.

1914 and 1939 Are Real History, Which Is Exactly Why They Need Precision
The historical parallels in this story are worth keeping, but they should be handled carefully. The classical gold standard really was disrupted by the First World War, when governments suspended or altered convertibility as wartime financing overwhelmed the monetary arrangements that had existed before 1914. That is a genuine historical example of a monetary system changing under extreme fiscal and military pressure. But it does not establish a repeating law in which a gold rally predicts the next world war.
Silver has an equally fascinating wartime history. During the Second World War, the United States Treasury loaned enormous quantities of silver to the Manhattan Project because the metal’s exceptional electrical conductivity made it useful in the electromagnetic separation equipment at Oak Ridge. That episode is real and remarkable. But historical precedent is not prophecy. The fact that governments have requisitioned strategically important metals during wartime tells us that metals can become strategically important. It does not tell us that today’s silver market is secretly being prepared for another Manhattan Project.
Silver Really Is a Different Story
Silver deserves separate treatment because its fundamentals are genuinely unusual, but the strongest version of the argument is not the one that claims governments are quietly stockpiling it for war. Silver is simultaneously a precious metal and an industrial material, and that makes its market behave differently from gold. The Silver Institute’s 2026 survey describes 2025 as a spectacular year for the metal: the annual average price rose sharply, the market experienced a fifth consecutive annual deficit, and the price ultimately reached above $121 an ounce in January 2026 before falling back sharply. The Institute expects another deficit in 2026, with mine production roughly flat and the structural shortfall estimated at about 46 million ounces.
But one number needs correcting. Industrial silver fabrication is not expected to reach roughly 720 million ounces in 2026. The Silver Institute’s 2026 outlook puts it closer to 650 million ounces, down about 2 percent from the previous year. That decline is important because it shows why the silver story cannot simply be reduced to “technology demand is exploding.” Solar manufacturers are actively trying to thrift and substitute away from silver because prices have risen. The long-term technology story remains significant, solar, electric vehicles, electronics, data centers and AI-related hardware all use silver, but rising demand in one sector does not mean every industrial category is accelerating simultaneously.
The more interesting story is therefore the tension between technological dependence and substitution. Silver is extremely useful precisely because its electrical and thermal properties are difficult to reproduce cheaply in every application. Yet high prices create an incentive to use less of it wherever engineers can. At the same time, mine supply cannot instantly respond because most silver is produced as a by-product of mining for other metals. The result is a market in which demand, substitution, recycling, investment flows and mine production are constantly fighting one another. That is a serious supply story without turning every ounce of silver into a military secret.

And there is another reason silver should not simply be folded into the gold conspiracy. Its industrial demand is measurable. Silver’s role in photovoltaics, electronics, electrical equipment, automotive applications and emerging data-center infrastructure is documented by industry research, and the Silver Institute expects technology-intensive sectors to remain important sources of long-term demand. AI may increase silver use across semiconductors, electronics and infrastructure, but the precise quantity will depend on engineering choices, substitution and the speed of deployment. The fascinating question is therefore not whether governments are secretly buying silver for the next war. It is whether an industrial economy becoming increasingly dependent on electricity can keep expanding its demand for one of the most conductive metals on Earth while miners struggle to increase supply.
The Debt Numbers Are Serious. They Still Do Not Prove a War Plan.
The debt argument is where a legitimate economic concern can most easily become a fictional causal chain. U.S. federal debt is enormous, global debt is measured in the hundreds of trillions of dollars by major international estimates, and the fiscal trajectories of many advanced economies are plainly difficult. Gold is naturally relevant to that discussion because it has no issuer, carries no corporate default risk, and has historically been used as a hedge against monetary and political instability. Economists and investors can reasonably disagree about how much protection that actually provides. None of that is controversial enough to require a secret explanation.
The leap occurs when debt becomes evidence of an intentional war strategy. The argument usually runs something like this: governments have too much debt, war historically destroys or restructures debt, therefore governments must be preparing for war. The first two observations do not logically produce the third. Governments can run unsustainable fiscal policies without secretly planning a global conflict. Debt can be inflated away, restructured, taxed, refinanced, grown out of through nominal GDP, or simply carried for decades. War is one possible historical mechanism of financial disruption, but history does not make it an inevitable policy choice.
This is precisely where an investigative article should become more demanding, not less. If leaders had already decided that a major war was necessary to reset the debt system, the evidence required would be much stronger than a rising gold price. We would need documented policy preparations, procurement patterns, mobilization decisions, financial directives, intelligence assessments or other independent evidence connecting the debt problem to a deliberate war strategy. Gold cannot supply that missing link by itself. A market can price the risk of war without proving that someone intends to start one.

The Most Interesting Signal Is Actually the Public Disagreement
The strongest evidence against the insider-exodus theory is not that nothing unusual happened. Something unusual happened. Gold’s 2025 performance was extraordinary. Its January 2026 breakout was extraordinary. Central-bank demand remains unusually strong. August ETF inflows were extraordinary. Silver experienced its own historic repricing. Government debt is enormous. Geopolitical risk is real. None of those facts should be minimized simply because some people attach a conspiracy to them.
The point is that the extraordinary facts are already sufficient. We do not need to manufacture a hidden cause to make them interesting. In fact, adding a secret cause makes the investigation weaker because it asks the reader to leap over the evidence that is actually available. The public record shows investors disagreeing about rates, inflation, currencies, deficits, geopolitics, central-bank reserves and industrial demand. It shows forecasts being raised and lowered. It shows buyers becoming sellers and sellers becoming buyers. It shows the market changing its mind.
That is almost the opposite of a coordinated escape.
The Rally Was Real. The Secret Explanatory Layer Wasn’t Necessary.
There is a temptation in every historic market move to search for the people who supposedly knew first. Sometimes insiders really do possess information unavailable to the public, and genuine financial conspiracies do happen. But the existence of insider trading in the world is not evidence that every spectacular price movement is an insider signal. The burden remains the same as it always is: show the information, show the transaction, show the connection, and show that the evidence survives independent scrutiny.
Gold’s 2025-2026 rally does not currently require that hidden layer. The market had visible reasons to reprice the metal. Investors were buying it as a hedge against uncertainty. Central banks were diversifying reserves. Rate expectations changed. Fiscal concerns persisted. Geopolitical risk remained elevated. ETF investors eventually returned in force. And professional institutions published competing forecasts throughout the entire process, sometimes spectacularly bullish and sometimes considerably less so.
The real story is therefore more interesting than the rumor. Gold did not merely rise because somebody supposedly knew something. It rose because millions of market participants collectively decided that the risks surrounding money, debt, geopolitics and financial stability were worth paying a historically high price to hedge. They were not all right. They were not all saying the same thing. They were not moving in lockstep. But together they created one of the most extraordinary precious-metals repricings in modern history.
And that leaves the most uncomfortable conclusion of all: you do not need an insider exodus to explain why people are buying gold. The public data already show what they are afraid of. The harder question is whether those fears are being priced correctly, or whether the market is still underestimating how much the world has changed.
NESARA follows an almost identical arc through a real financial event, a genuine fraud case that got reinterpreted into a global reset myth the same way gold’s real 2026 price spike got reinterpreted into a secret insider exodus